Dashboards
Dashboards are a convenient way to view all the important information about your project in one place. Using dashboards, you can quickly assess the status of your test cases and observe various trends to determine if there are problems that require further attention.
Each dashboard is a set of widgets — information panels that cover different aspects of your project. This can range from the total number of test cases in your project to the daily time spent running test cases with a specific tag.
Newly-created projects in Allure TestOps don't have a default dashboard, but you can quickly create one from a template.
Choose a dashboard by question
Start with the question you need answered.
Launch health
Use this when the question is "What is happening in the latest run or recent runs?"
Recommended widgets:
- Launch Analytics
- Launch Trend (by date)
- Last Launch Pie Chart
- Launches
Useful AQL examples:
- Launches query:
tag = "smoke" - Launches query:
ev["Release"] = "1.2.3"
Automation coverage
Use this when the question is "How much of this area is automated and how is that changing?"
Recommended widgets:
- Test Case Pie Chart with automation view
- Automation Trend
- Test Case Tree Map Chart
Useful AQL examples:
- Test cases query:
layer = "API" - Test cases query:
tag = "checkout"
Release tracking
Use this when the question is "How does one release or release candidate look across time and launches?"
Recommended widgets:
- Launches
- Launch Trend (by launches)
- Launch Analytics
- Last Launch Pie Chart
Useful AQL examples:
- Launches query:
ev["Release"] = "1.2.3" - Launches query:
name ~= "release"
Failure concentration
Use this when the question is "Where are the most important failures or weakest tests concentrated?"
Recommended widgets:
- Low Performing Tests
- Launch Analytics
- Last Launch Pie Chart
- Test Case Tree Map Chart
Useful AQL examples:
- Test cases query:
tag = "critical" - Test cases query:
cf["Feature"] = "Payments"
Creating dashboards
To create a dashboard:
- Open your project.
- Go to Dashboards.
- Choose a method for creating a dashboard: from a template or from scratch.
Dashboards created from templates contain a predefined set of widgets, which can be customized. Dashboards created from scratch have no widgets, you have to add them manually.
You can configure more than one dashboard for your project. To add another dashboard, click + in the dashboard tab bar. You can reorder the tabs in the tab bar by dragging them, like you can do in a web browser.
To rename or delete the current dashboard, click ⋯ in the upper-right corner of the screen.
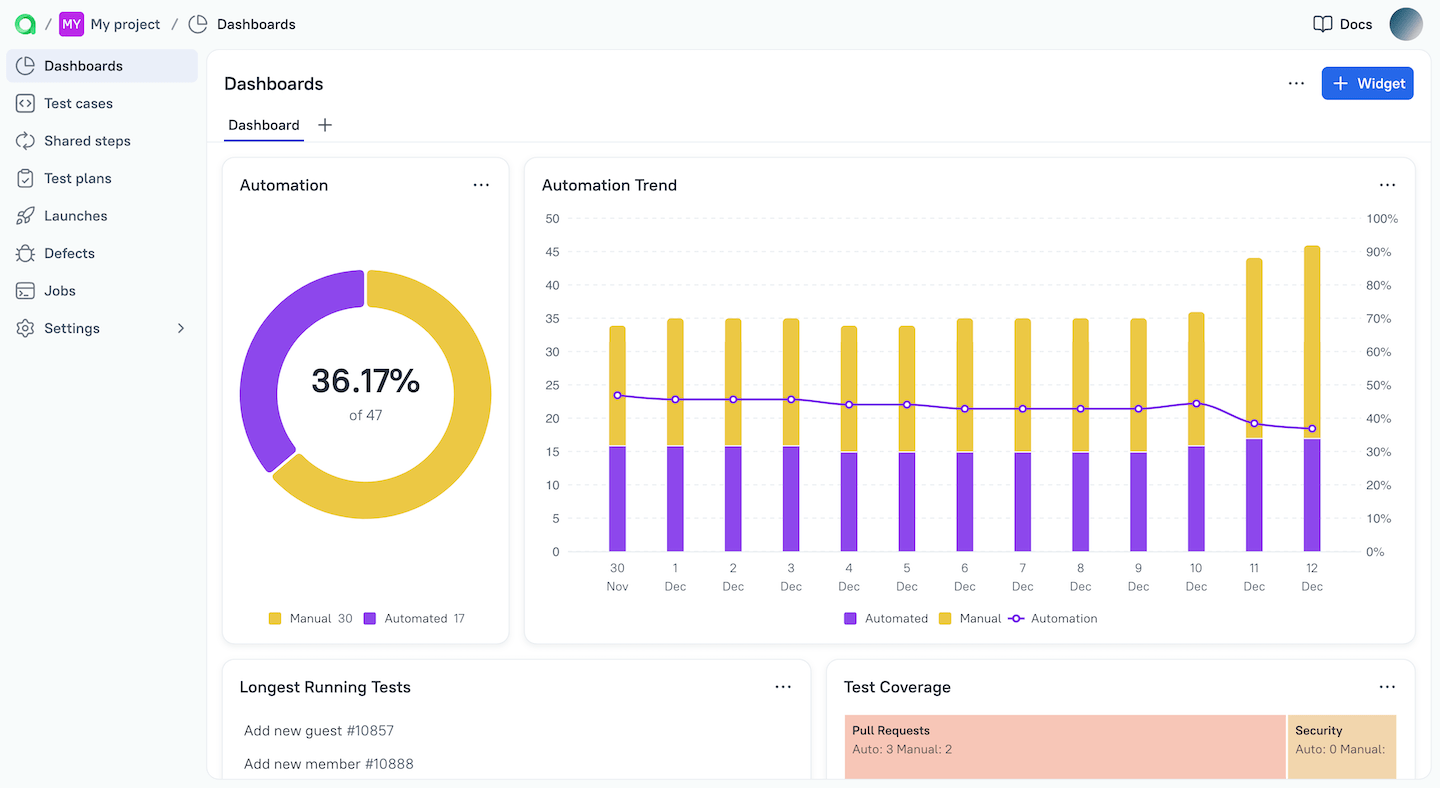
Automation dashboard
When creating a dashboard, you can select the Automation template, which consists of four widgets:
- Test Case Pie Chart (Automation) — shows the current ratio of manual and automated test cases in your project.
- Automation Trend — shows how the automation ratio changed over time.
- Low Performing Tests (Longest Running Tests) — shows a list of test cases with either the lowest success rate or the longest execution time. You can filter both the test cases and the launches for this widget using AQL.
- Test Case Tree Map Chart (Test Coverage) — shows the distribution between automated and manual test cases using a specific tree of your project.
You can find more information on all available widget types in the subsection below.
Recommended dashboard patterns
If you are creating the first dashboard for a team, these patterns are a good start.
Daily launch review dashboard
Purpose: quick orientation for the current run queue.
Recommended widgets:
- Launches
- Last Launch Pie Chart
- Launch Trend (by date)
Automation progress dashboard
Purpose: show whether automation coverage is improving and where manual-heavy areas still remain.
Recommended widgets:
- Test Case Pie Chart
- Automation Trend
- Test Case Tree Map Chart
Release dashboard
Purpose: keep one release or branch visible as a named reporting slice.
Recommended widgets:
- Launches
- Launch Analytics
- Launch Trend (by launches)
Recommended filter style:
- Launches query with a dedicated release environment or tag, for example
ev["Release"] = "1.2.3".
Hotspot dashboard
Purpose: highlight unstable or expensive tests and areas that need investigation.
Recommended widgets:
- Low Performing Tests
- Launch Analytics
- Test Case Tree Map Chart
Team ownership and KPI dashboard
Purpose: keep one team's slice visible without turning the dashboard into a single-launch view.
Recommended widgets:
- Launch Analytics
- Automation Trend
- Low Performing Tests
- Launches
Recommended filter style:
- use team ownership, layer, tag, or custom-field filters consistently across the widgets so the dashboard answers one operational question instead of mixing several unrelated scopes.
Data display period
By default, most widgets display data only for the last 14 days. Because of this, if you did not run tests in the last 2 weeks, some widgets may be empty.
When entering an AQL query in widget settings, the number displayed is the number of found results for all time, not just the current period. This number may differ from the data displayed by a widget.
To change the data display period:
In the Dashboards section, select a dashboard.
Under the dashboard tab bar, click Last 14 days and select an option from the drop-down list:
- Last 7/14/30 days — show data for the last 7, 14, or 30 days.
- Custom — show data for a specific period.
If you selected the custom period, click the drop-down list on the right to select the period.
The custom period cannot exceed 30 days.
Some widgets display data for all time, regardless of the period selected. Such widgets are labeled All time on a dashboard. For some of them, you can change the display mode by turning on the Enable dashboard date picker toggle in widget settings.
Why a widget can be empty even when the query looks right
Before treating an empty widget as an ingestion failure, check these conditions first:
- The dashboard date picker may still be set to the default Last 14 days while the matching data is older.
- The widget may use a narrower launch or test-case query than you intended.
- The widget type may show only the current period unless Enable dashboard date picker is configured the way you expect.
- Some widgets update on their own schedule, so newly uploaded data may not appear instantly in every chart.
Adding widgets to dashboards
To add a new widget to a dashboard:
- In the Dashboards section, select an existing dashboard or create a new one.
- Click + Widget in the upper-right corner of the screen (or right-click the dashboard name and select Add widget).
- Choose a widget from the list and configure it.
- After you finish configuring the widget, click Add widget.
You can change the name of a widget to something more descriptive, which can be especially useful if you specified an AQL query to filter test cases or launches.
Widgets on a dashboard can be moved around and resized:
- To change the position of a widget, drag its title to the desired position.
- To change the size of a widget, drag its border.
To edit, remove, or duplicate a widget, click ⋯ in the upper-right corner of the widget or right-click anywhere on it.
Widget queries are narrower than general AQL
Dashboard widgets do not expose the full flexibility of every AQL context. This is especially important if you already use AQL heavily in API calls.
- Widget filters are limited by the widget type and the fields it supports.
- Test-results AQL is an API-oriented context and is not the same thing as a dashboard-widget query surface.
- Functions such as
now(),dayStartUtc(),weekAgo(), andcurrentUser()are not supported in widgets.
Available widgets
Allure TestOps supports the following widgets:
Text Block
A simple widget that displays static text. You can use it to describe the contents of a dashboard, for keeping notes, etc.
Launch Analytics
Widget provides daily statistics on your launches for the current period, such as the total number of launches/results that day, the average execution time, etc.
You can additionally filter the test cases and launches that will be used to calculate the statistics using AQL. For example, if you want to include only test cases that have the web tag, use the following query in the Test cases query field: tag = "web".
Launch Trend (by date)
Widget shows the distribution of launches by their result (test passed, test failed, etc.) over the last days, weeks, or months. To use only the currently selected period, turn on the Enable dashboard date picker toggle.
You can filter the test cases and launches for this widget using AQL. For example, if you want to include only test cases created by the user John, use the following query in the Test cases query field: role["Owner"] = "John".
Test Case Pie Chart
Widget displays the automation ratio, the workflow status ratio, or the launch result ratio of your test cases as a pie chart. You can filter the test cases for this widget using AQL.
Automation Trend
Widget shows how the automation ratio changed over the current period.
Low Performing Tests
Widget displays a list of test cases with either the lowest success rate or the longest execution time. You can filter both the test cases and the launches for this widget using AQL.
Test Case Tree Map Chart
Widget displays the automation ratio of your test cases using the specified tree of your project. For example, if you select the Suites tree, the widget will display the automation ratio for each of your test suites. You can additionally filter the test cases for this widget using AQL.
Launches
Widget displays all recent launches as a list. To show only launches for the current period, turn on the Enable dashboard date picker toggle.
You can filter the launches for this widget using AQL.
Last Launch Pie Chart
Widget shows test results from the latest launch as a pie chart. You can select the launch to be displayed using AQL. For example, type tag = "smoke" into the Launches query field to select the last launch of a test case with the smoke tag.
To display the latest launch of the current period, turn on the Enable dashboard date picker toggle.
Launch Trend (by launches)
Widget displays all launches for the current period as a bar chart. You can filter the launches for this widget using AQL.
When dashboards are better than other views
Use dashboards when:
- you want a stable project-level view rather than a single launch;
- the same analysis should be reused by the team regularly;
- the question is about trends, concentration, or coverage rather than one failure.
Use Launches when the question is still about one concrete run.
Use Compare launches when the question is specifically about differences between selected launches.
Cloning dashboards
You can use existing dashboards as templates to create dashboards in the current or other projects.
To clone dashboards in the current project:
- Select a dashboard in the Dashboards section.
- Click
⋯in the upper-right corner of the screen or right-click the dashboard name. - Select Clone to → This project. The dashboard copy will be added to the current project.
To clone dashboards to other projects:
- Select a dashboard in the Dashboards section.
- Click
⋯in the upper-right corner of the screen or right-click the dashboard name. - Select Clone to → Another project.
- Select a project to which the dashboard should be cloned.
- Check the Preserve AQL settings box if you want to keep the AQL queries configured in the widget settings.
- Click Clone. The dashboard copy will be added to the target project.
Using widget data through the API
If you need to extract or automate around a widget rather than just view it in the UI, start from the widget in the browser:
- Open the dashboard and load the widget you care about.
- Inspect the network request in browser DevTools.
- Identify the endpoint, payload, and filters used by the widget.
- Reproduce the request with Bearer-token authentication if you need the same data outside the UI.
This is often the fastest path when there is no dedicated widget-export page in the docs yet.
Next steps
- AQL to build reusable dashboard filters.
- Launches for the source execution data.
- Analysis for choosing the next analysis workflow.
