Allure Testops quick start for QA Lead
The basics
In this quick start guide we'll try to give a little push to start using Allure Testops.
Also, to start you need to create a project, team up, organize tests, create test plans, start working and get analytics and metrics.
The plan
- Create a project.
- Add team members.
- Test cases and test results groupings
- Creation of test plans
- Creation of the launches
Create project
In Allure Testops everything goes in a project. No project basically means no work can be done.
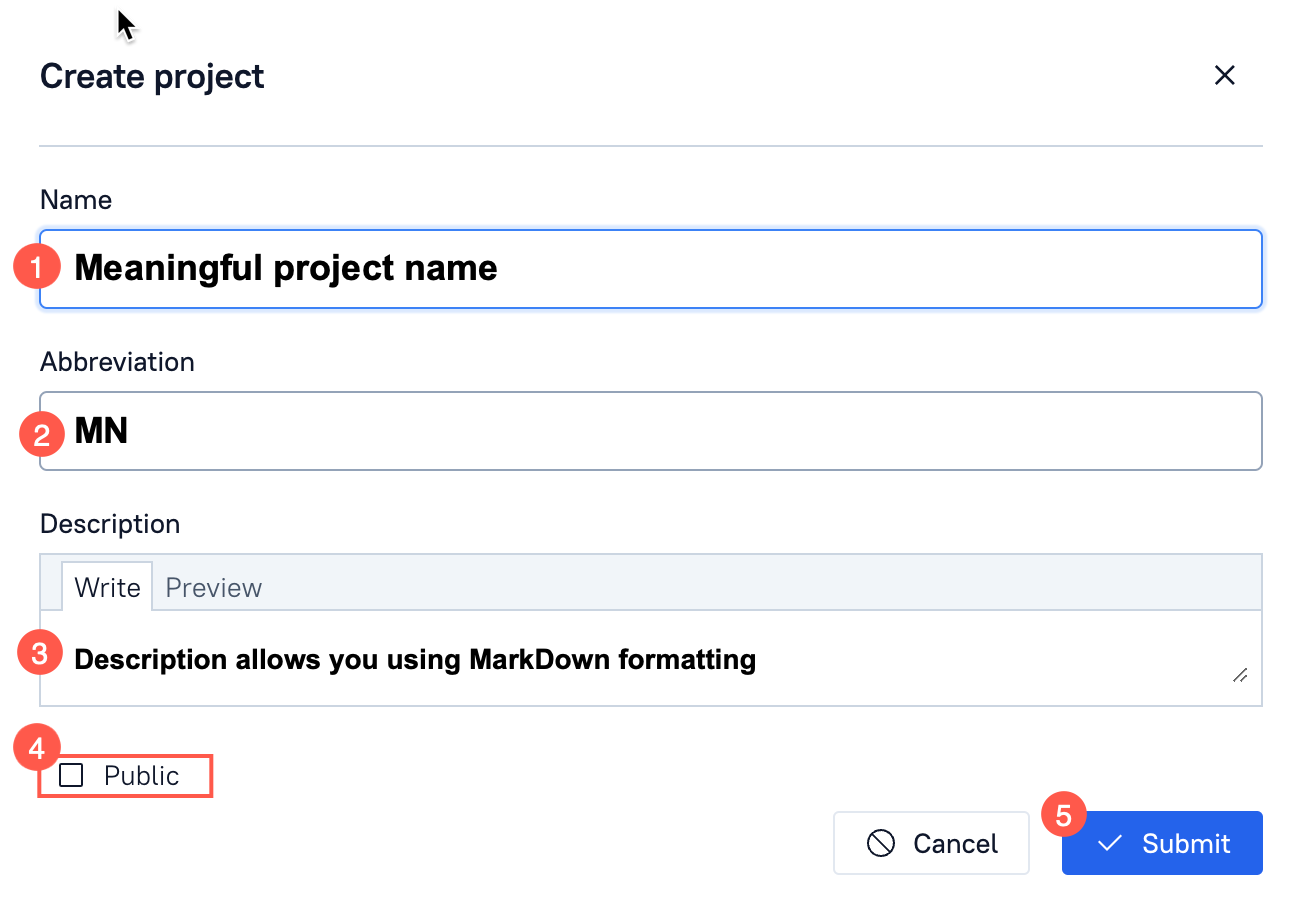
In main Allure Testops UI click + New Project button in upper right corner.
- Name your project.
- Add comments or description.
- Decide whether it should be public or not (see Project visibility below for clarifications).
- Hit Submit to start working on your new project.
Project visibility
Projects are private by default if not explicitly specified as Public.
Public projects are visible and accessible by every person that has an account in Allure Testops.
Private projects are not visible for registered users that aren't added to these as project team members.
Abbreviation
Abbreviation is required now, but it will phase out in upcoming releases.
Adding team members
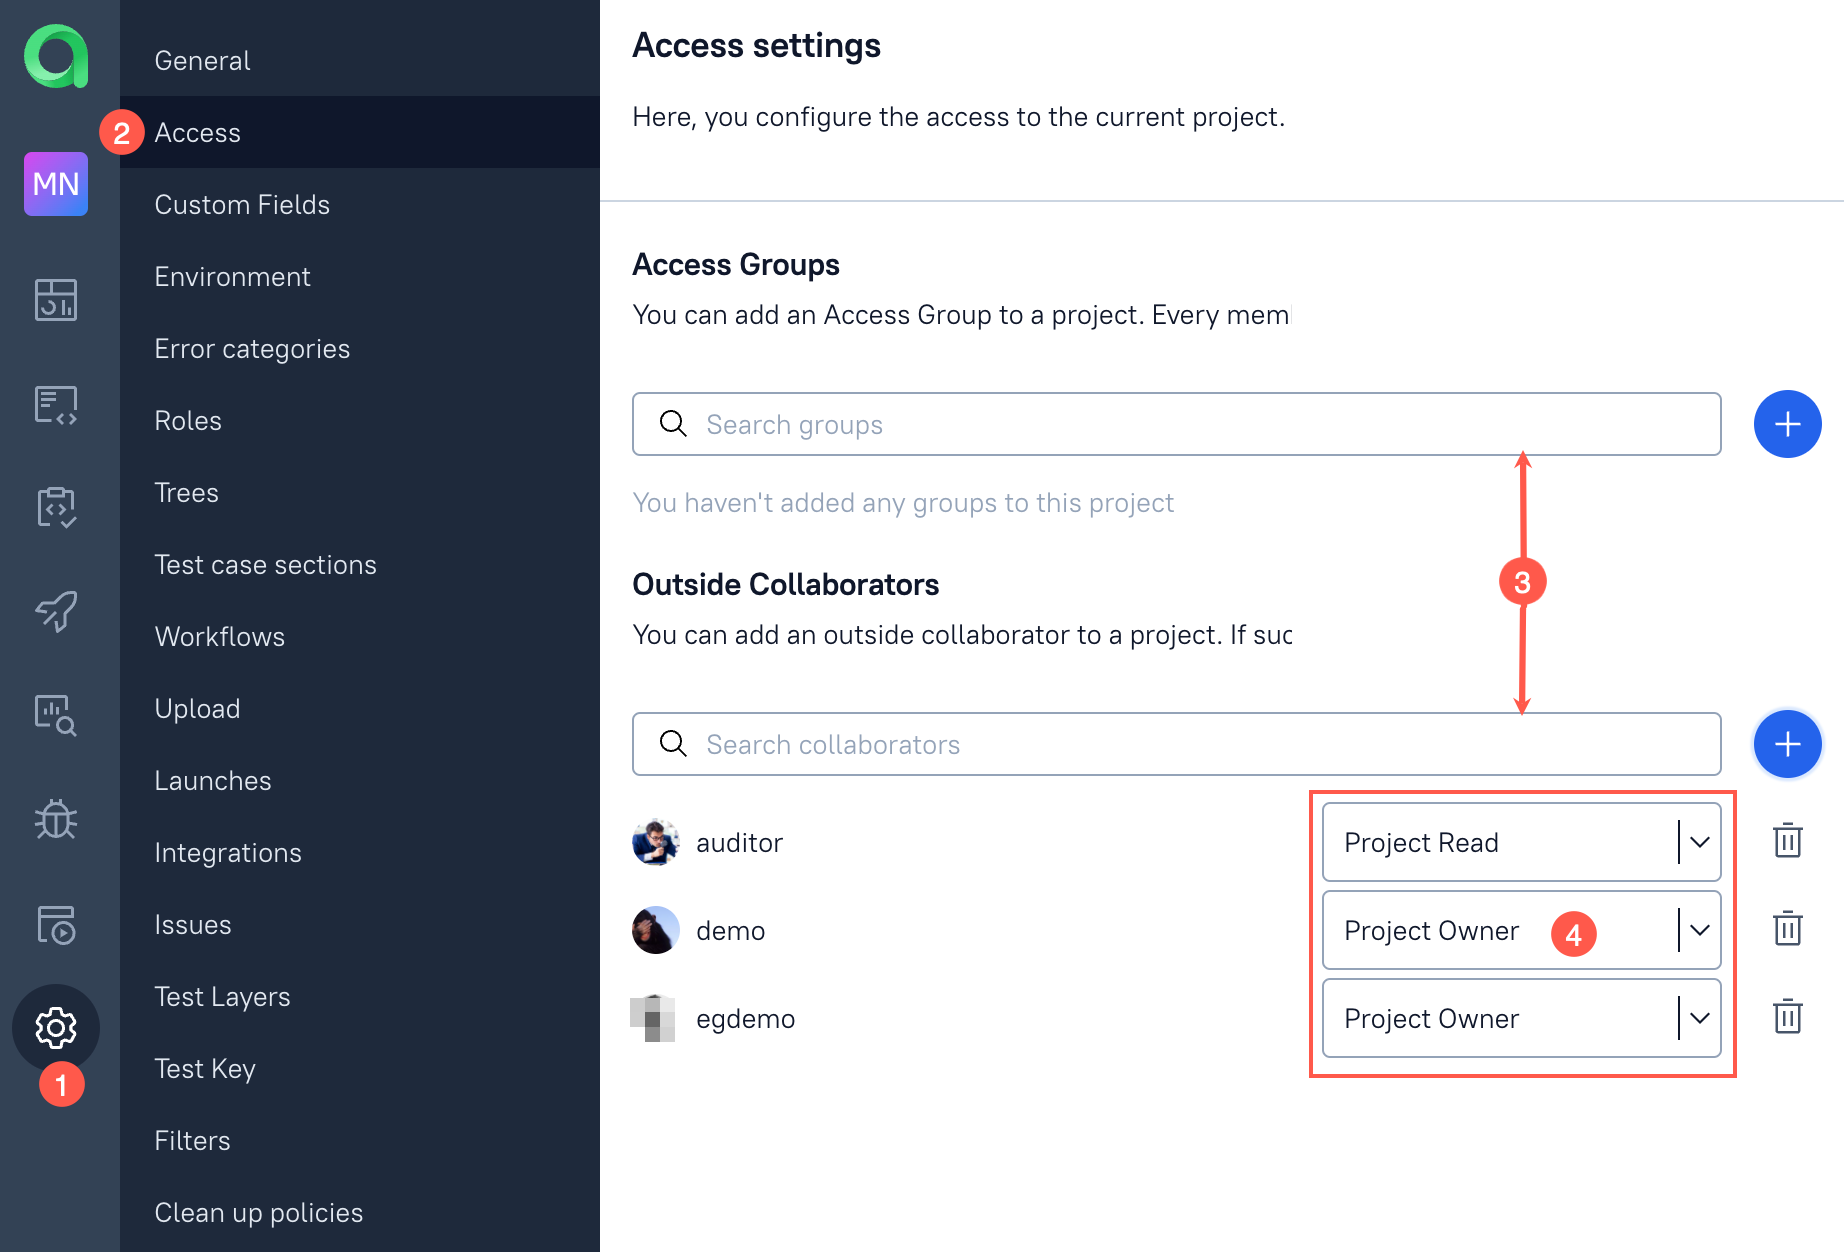
The person created a project will automatically become an owner of the project.
To add team members to your project do the following:
- In a project jump to the Settings.
- Select Access.
- Either in Groups or in Collaborators section find needed group or a person
- Set permission level for new team member (group) and click green plus button.
Groups
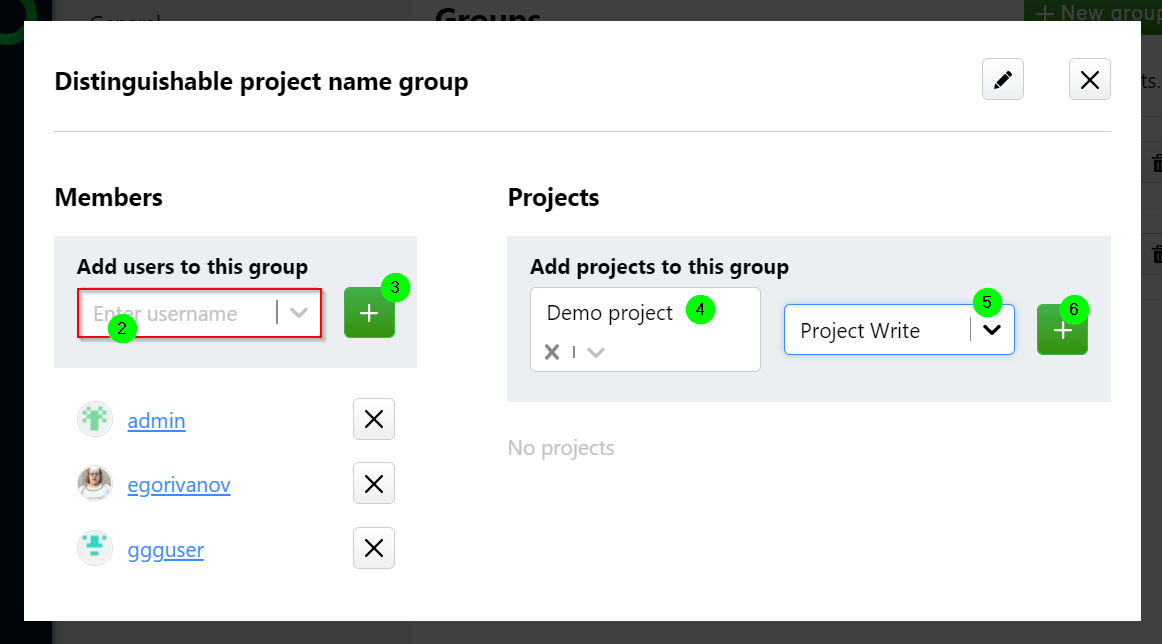
Another way to manage the access to a project and in case you have more than 2 team members is the usage of groups.
To create a group you need administrator's access rights.
Jump to the Administration section.
Select Groups and create new group by clicking green +New group button.
Name your new group.
Add members to your group as per image below.
Test cases
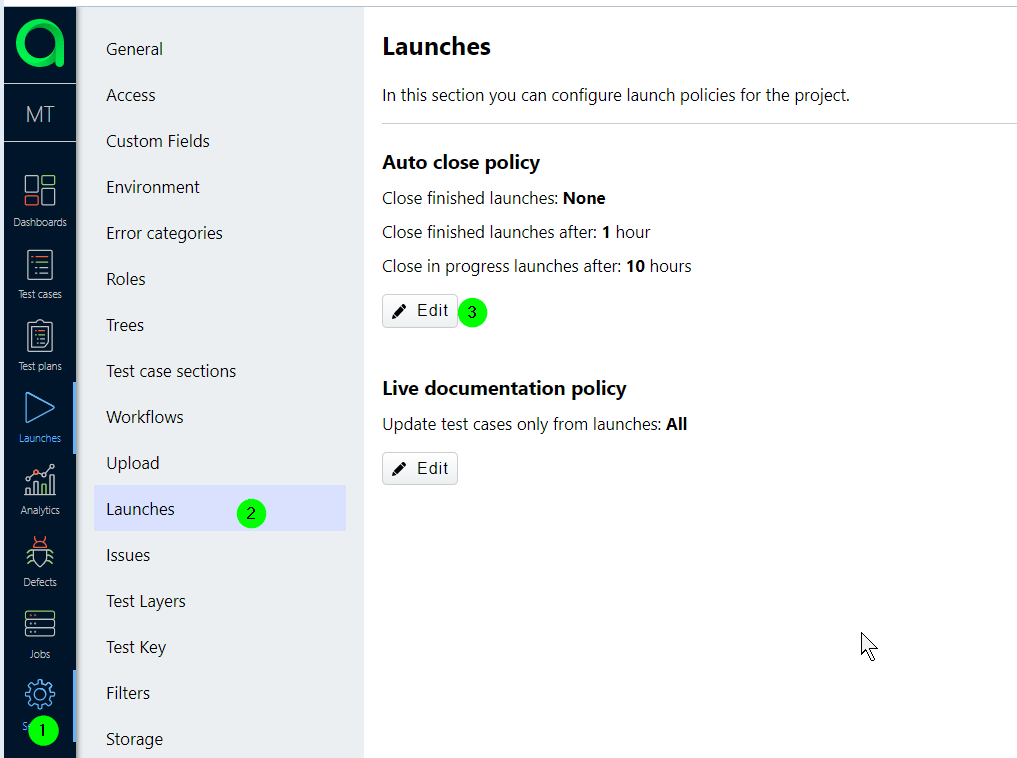
Allure Testops generates tests documentation (test cases and sometimes we also refer to it as Smart Test Cases feature) based in the test results and meta information provided with test results. Tests documentation is generated/updated only for closed launches.
You can close launches manually by pressing Stop button (square-like) for a launch, or you set up the automatic closing either on global Allure Testops level (admin rights, yes) or on a level of a project:
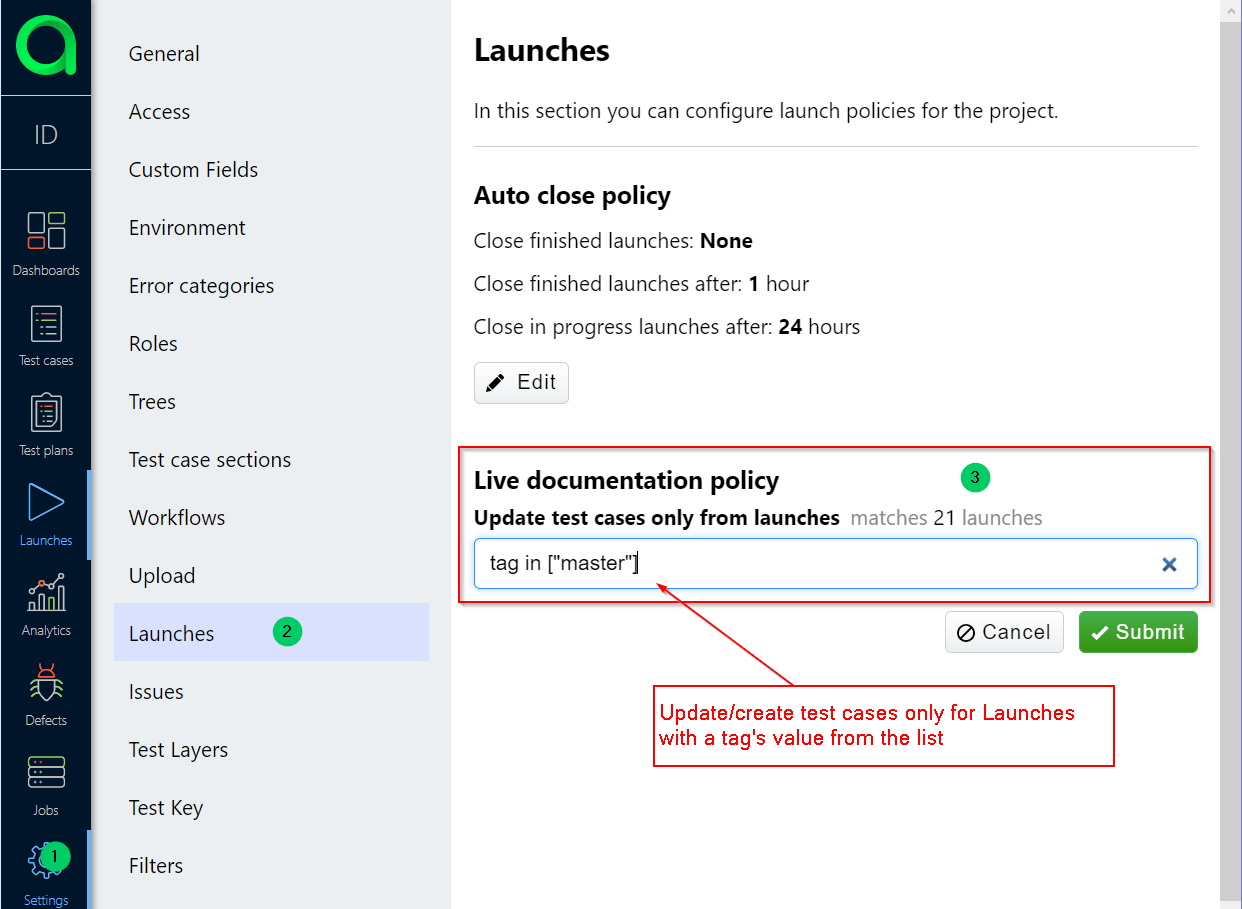
Conditional update of the test cases
Create/update test cases based on launch parameters
Say, you need to update/create test cases only when your tests are running on a certain branch from VCS, master branch would make sense as you will merge things that certainly work into master branch. So to avoid creating test cases in your documentation from other branches you need to supply a tag with value master for a launch.
Source of the meta-information - Allure or test results
Despite the fact, we evangelize the idea that test must contain all the information about themselves, and tests must be the only source of truth about themselves, but anyway...
If you've chosen the path of creating and maintaining of the metadata in Allure and ignore all/some metadata coming from test results, you can create an upload policy and specify what are you going to keep where.
- Jump to project settings.
- Then to Upload section.
- Then create metadata upload policy.
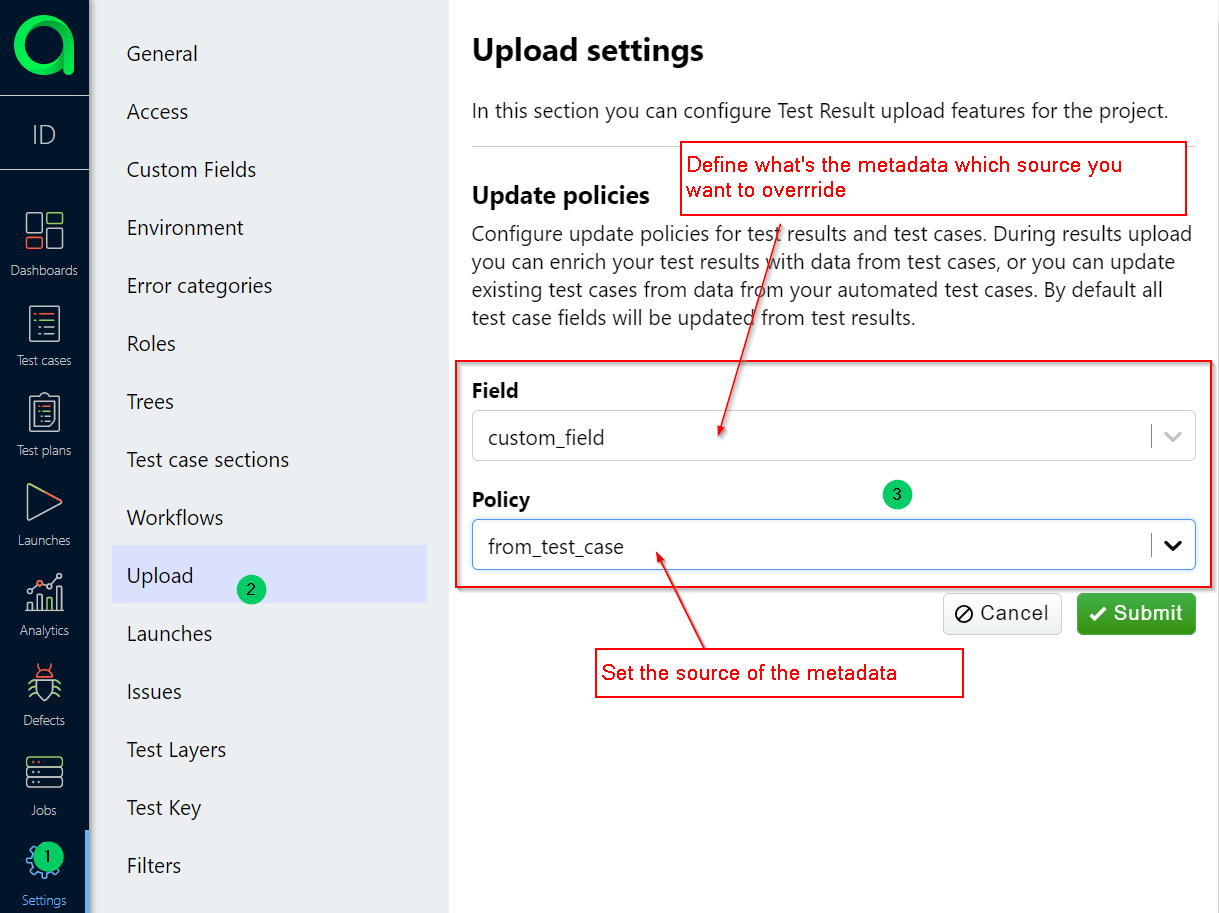
WARNING: If you've created some metadata manually in Allure and you haven't specified any rules to maintain the metadata on Allure Testops side, then all your data will be lost after the very next launch is closed as the default rule is the update and creation of test cases from the test results. We've just warned you.
Run test cases
If you select more than zero test cases in your current tree, you can run test cases from Allure Testops on your CI. Just select, click on bulk actions for test cases and use Run menu item. New Launch will be created with the number of test cases you selected.
There is a catch. To run certain tests (not all) your test framework need to support selective test run, otherwise all the tests in a build job will start and you will have the number of test results exceeding the number of tests.
There is a list of frameworks that we've married with the selective run already and there are the others we haven't, so if your framework is not in the list, please register FR to support the selective test run.
The list:
- JUnit4
- JUnit5
- TestNG
- PyTest
- nunit (draft)
- mocha (draft)
Test Plans
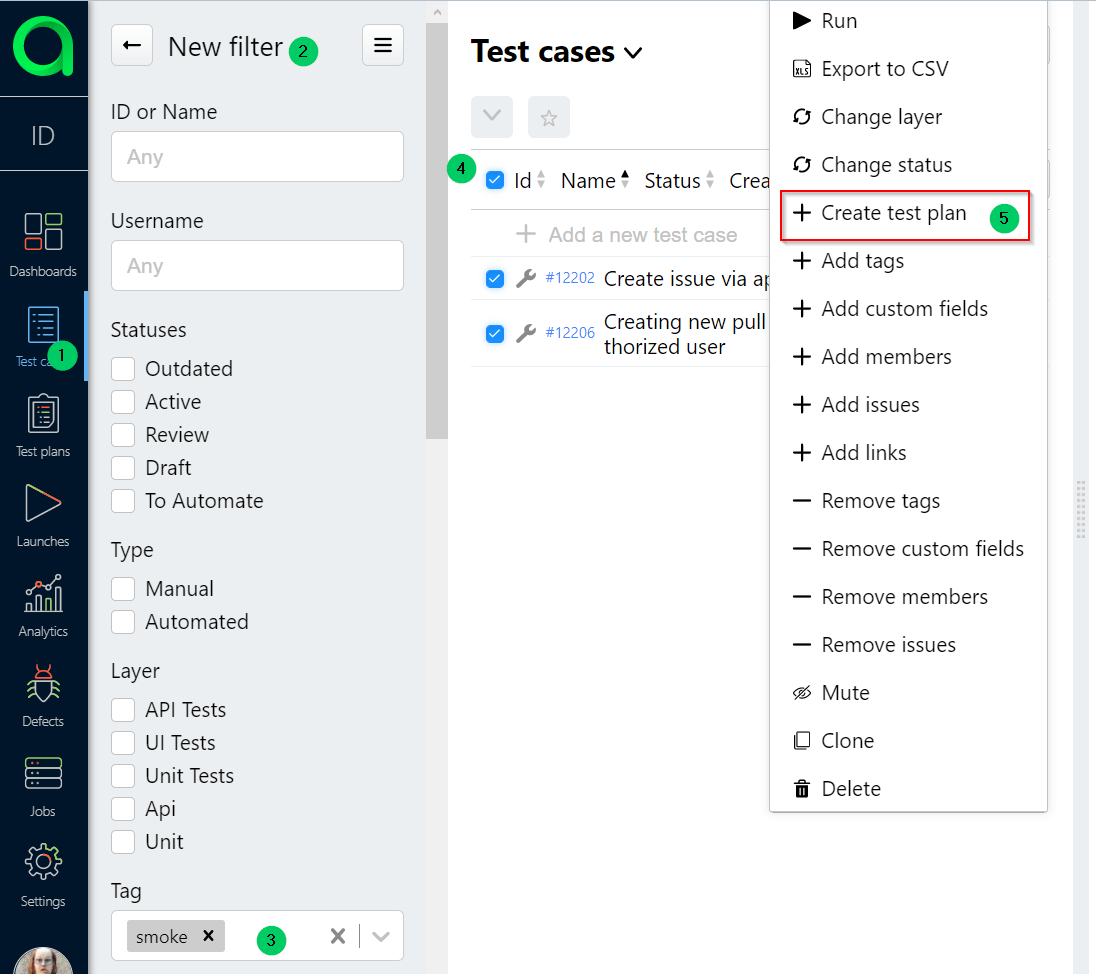
Test plan is the grouping of the test cases into a list based on some logic or with of a person creating a test plan.
Say, you need to run tests if they are related to smoke tests or to regression testing, so you mark them with tags as smoke and/or regress, then to avoid tedious task of filtering and then selecting and then running tests based on filter, you just send filtered tests to a test plan:
Then you need to assign cool clear meaningful name to your test plan.
Test plan can be updated in its settings and synced with the current state of test cases, i.e. if you created test plan based on a filter like tag in ["smoke"], then if new test cases with tag smoke were created then after the sync they will appear in the test plan. Brilliant, isn't it?
So, having a test plan created you can run only needed test cases based on your logic or desire.
Defects
Oh, you are gonna love it! You need to show this article to your team as well.
Defects will save you a lot of time on test results analysis:
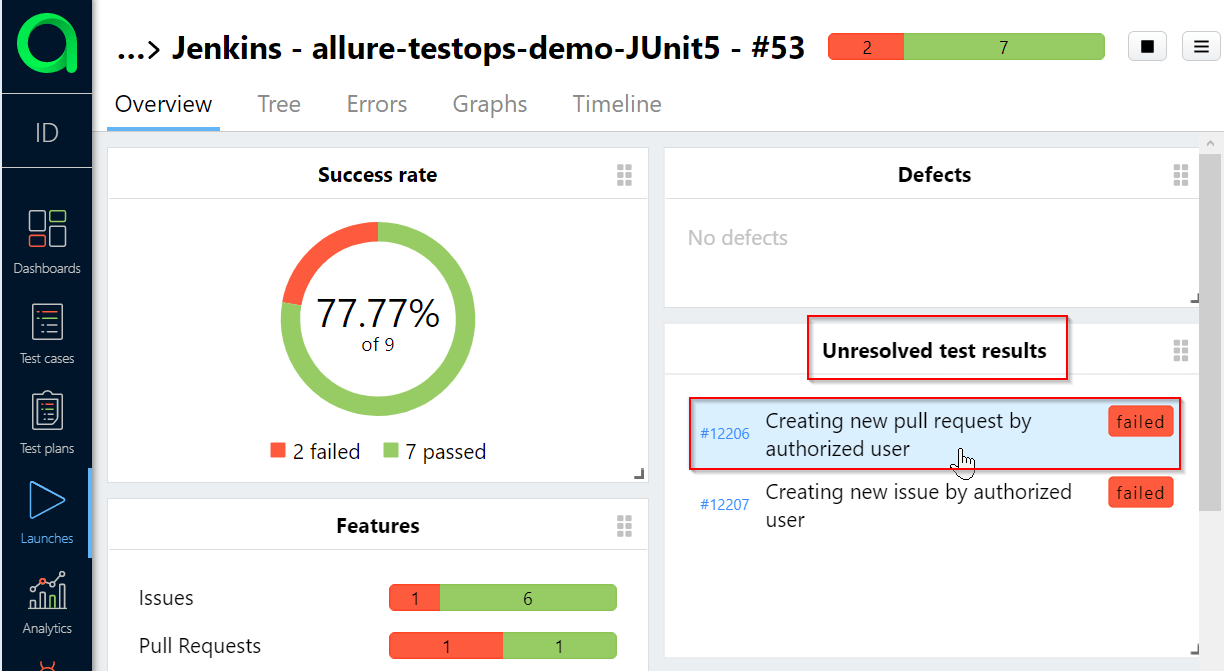
Say, you have failing tests
Can you tell how many of the failed tests you have already analysed without looking into error messages and traces whatsoever?
Hint: We can, so can you.
Let's create some defects. To do that select any failed test in the list of unresolved test results in a launch with failing tests.
In the failed test we need to check what's the error message provided in test results.
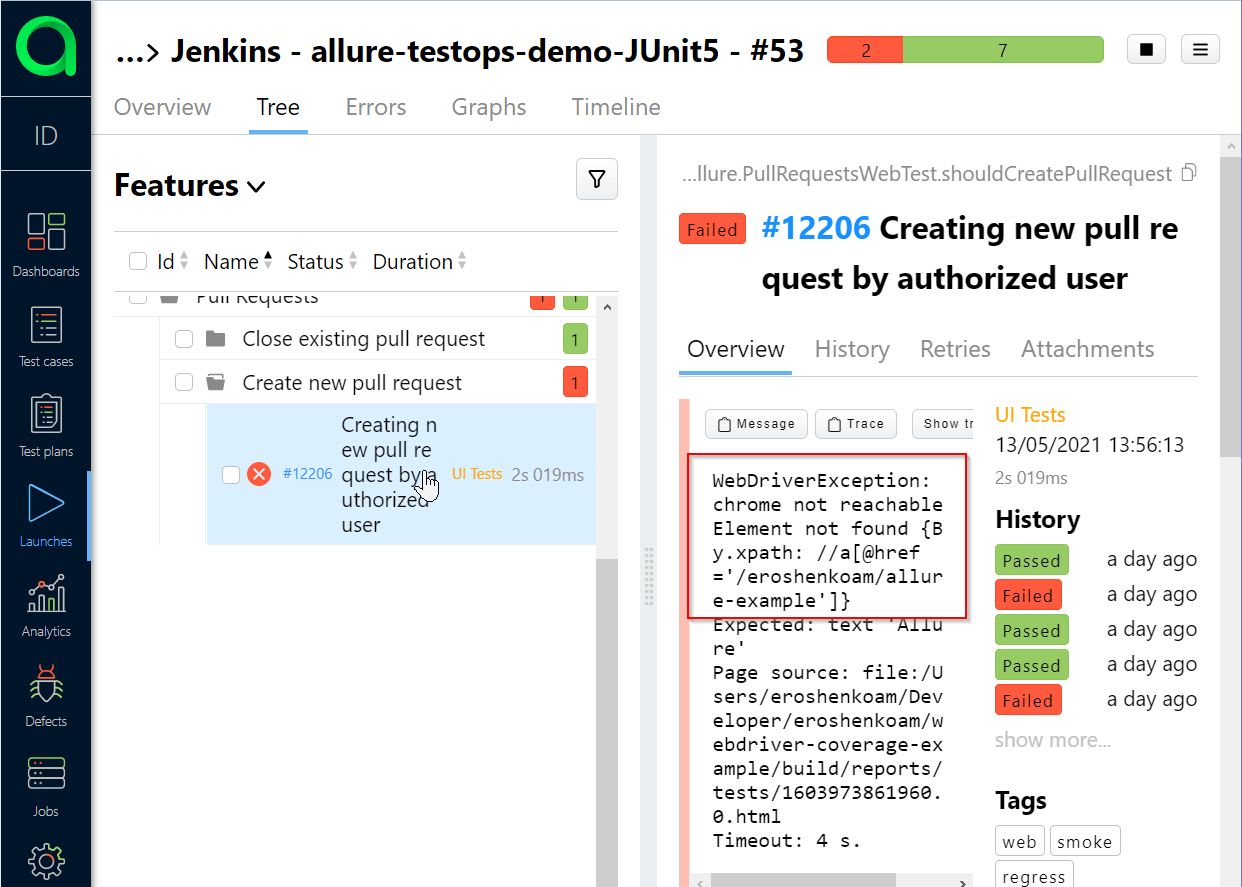
After the investigating, we decided that Selenium cluster is not working properly and all further tests with the same error message will be about the same problem, which is a defect.
So defect will be a problem we understood, processed and for which we've taken some actions. In this case further error messages do not need to be analysed and we can create a defect for this test.
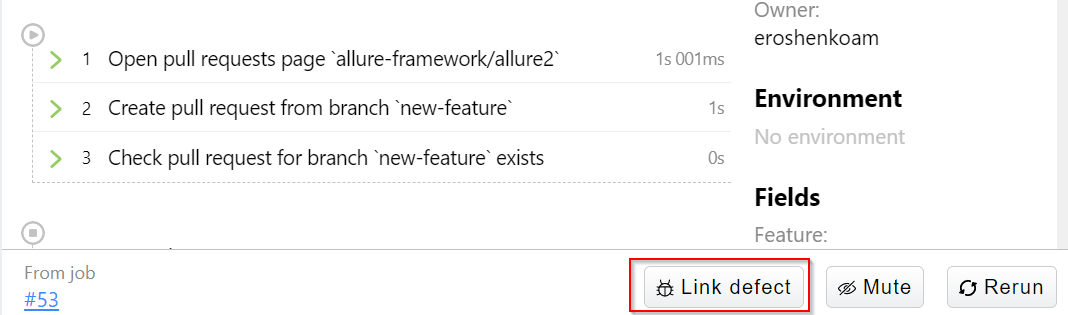
Click Link defect button at the bottom of test result area.
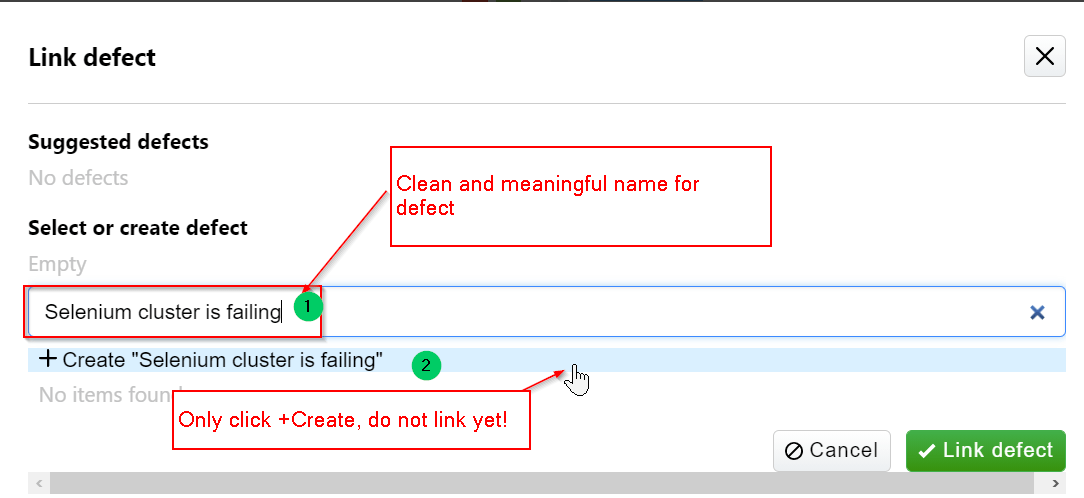
Add new Defect's name or select form a list of opened defects, latter is easy, so we'll proceed with the former (creating a new one):
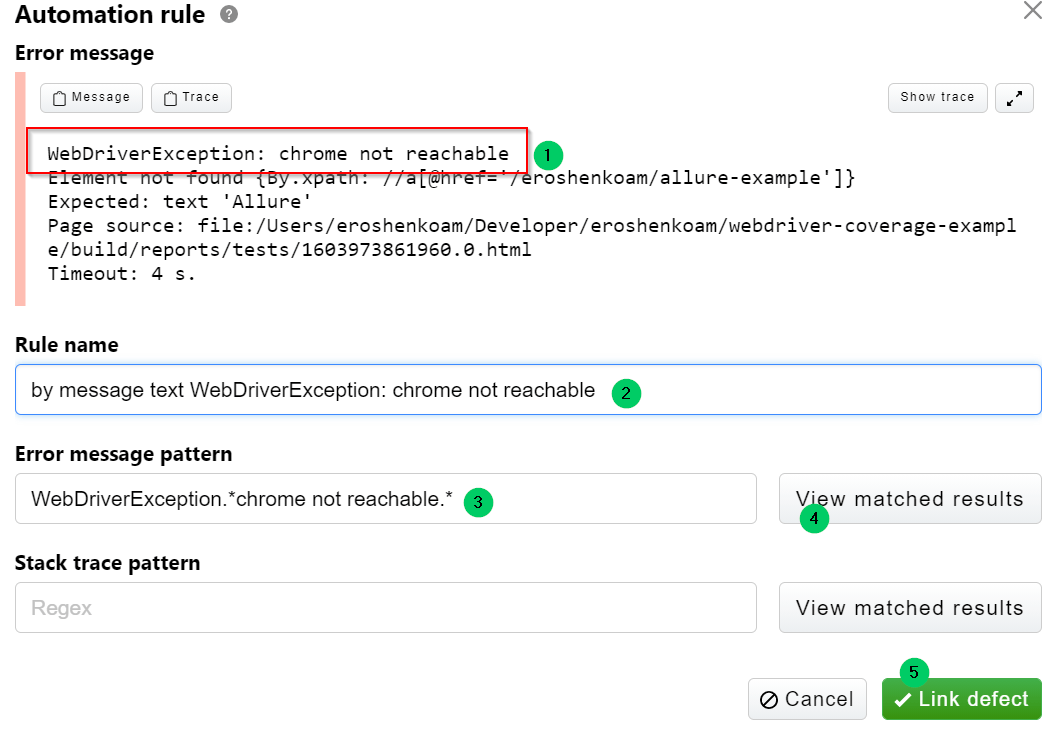
In next window click on Create automation rule.
In the next window you need to to the following:
- Define part of error message or part of stack trace that 100% defines your error.
- Name the rule (again, clear meaningful name for the rule is our choice).
- Create regular expression to find the message.
- View the results, if you don't see your failed test result, then you need to adjust your regexp.
- Click Link defect.
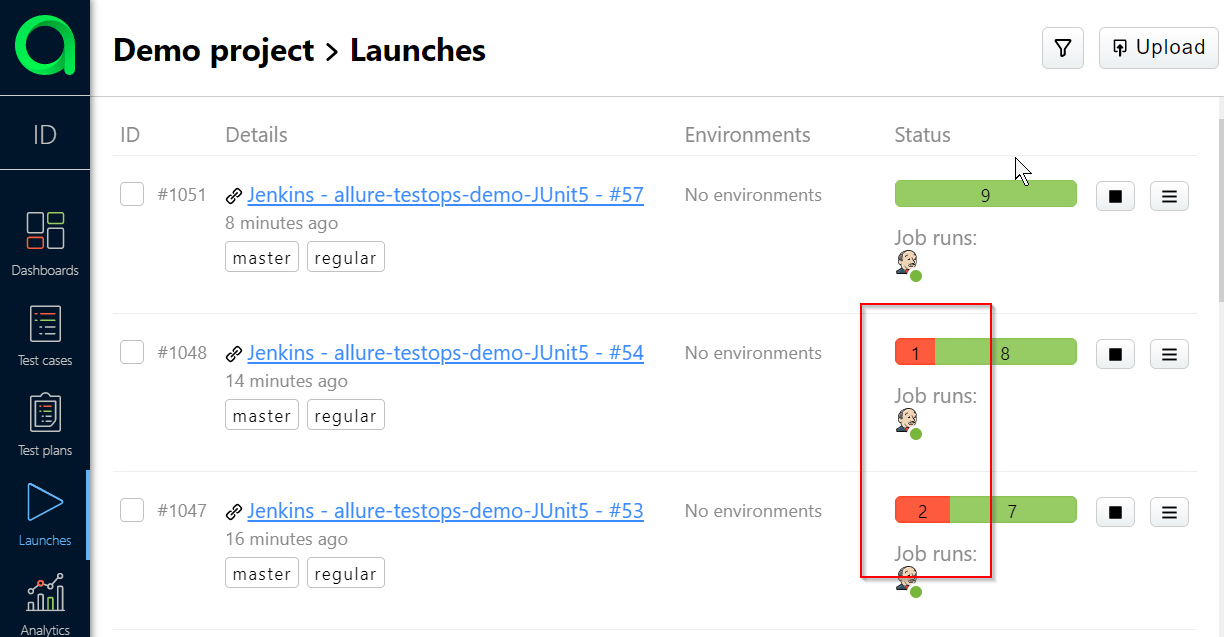
Then go back to launches, and check the lay of the land:
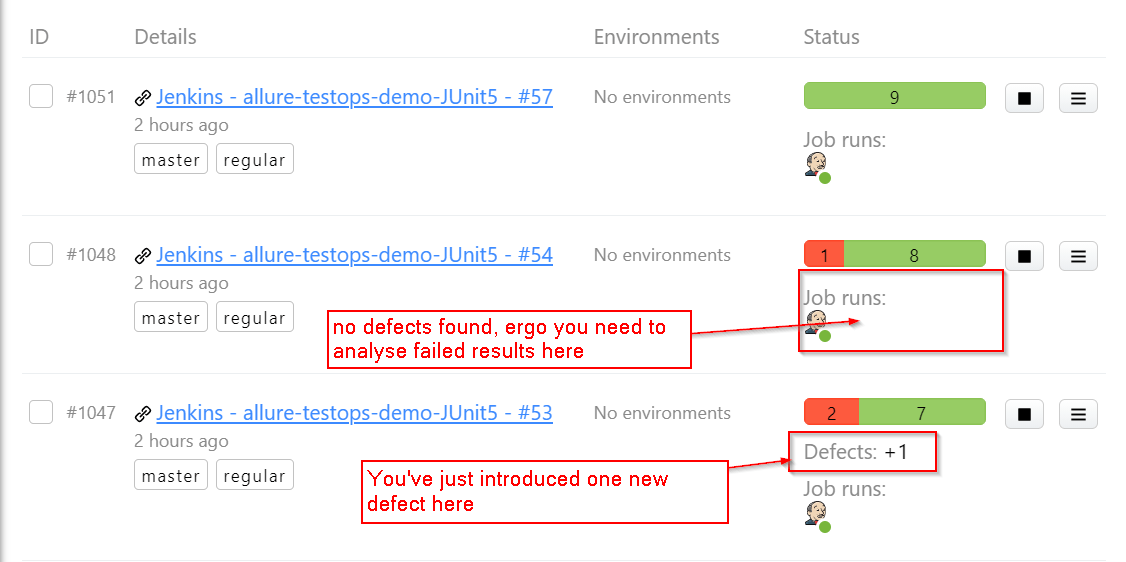
You see that there is 1 new defect in Launches with failed tests, so next step is the analysis of all failed test results and linking those to new defects. In all consecutive launches, if the same error appear you will see the following on the overview tab.
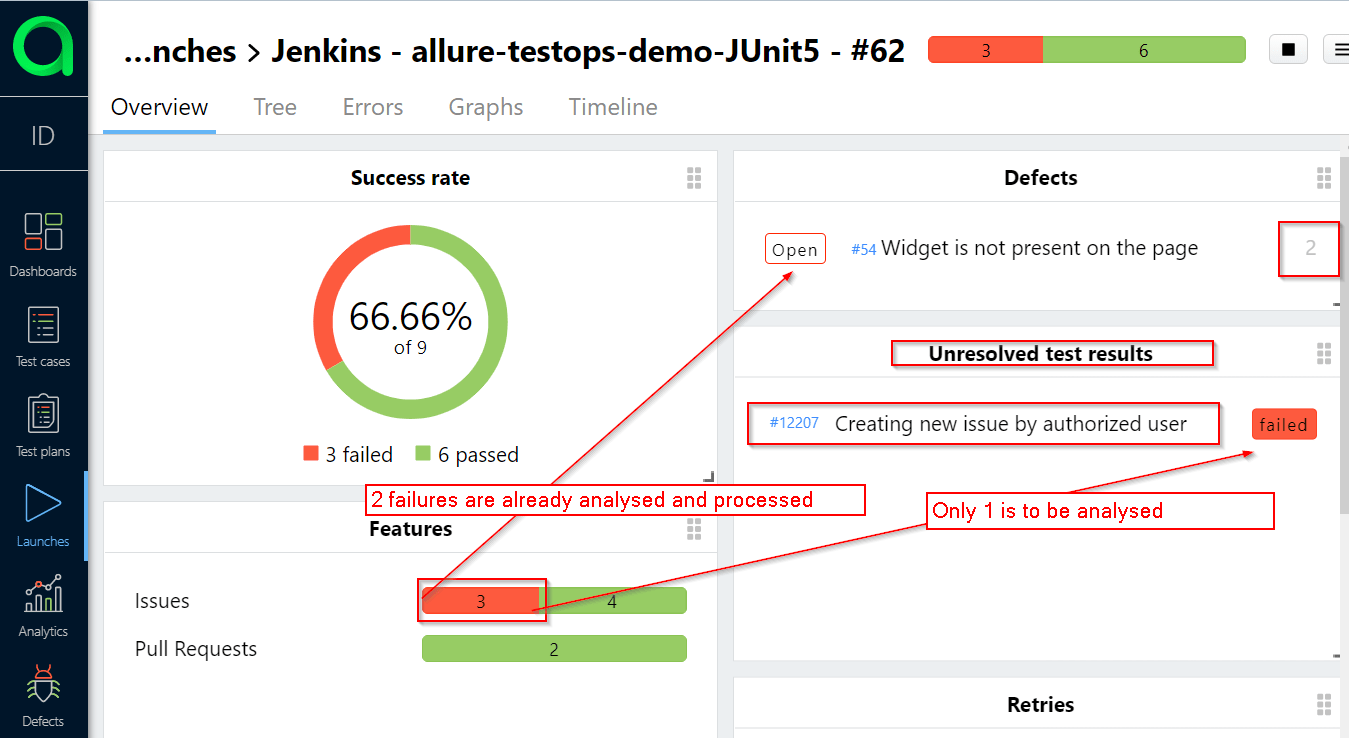
So there are 2 failing tests with the same one defect, and 1 in Unresolved test results section. So you need to analyse only one test instead of 3.
Say, you spend 5 minutes to analyse and process 1 failed test, so avoiding this on 10 failed tests you will take back 50 minutes and use them more effectively.
A defect can be linked to an Issue in issue tracker, thus the lifecycle of a defect will be updated (open to closed and vice versa) accordingly to the status of the issue.
We also recommend you to read section dedicated to [Mutes], they will remove the noise of tests that are permanently broken/failed.
Dashboards
Dashboards will allow you to get quick visual analysis on what's happening with your tests. You can get quick information generally on the success rate of the tests, their duration and per QA automation engineer.
Dashboards - Overview
On the overview tab of the Dashboards section you will find the general information about your project.
You can check what's there, we won't make any screenshot as each Overview page is better than a screenshot and if you want some additional tailored information you need to create your own dashboard (+New dashboard button) and add some widgets there.
Adding new widgets
Okay, let's gather some insights per QA automation engineers.
We'll create 3 widgets per engineer:
- Number of tests.
- Tests success rate.
- Tests duration.
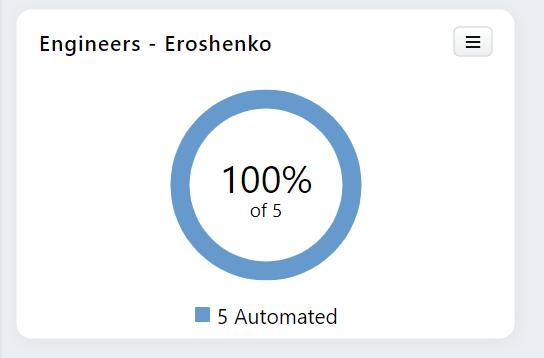
Adding Pie chart widget - number of tests
Create new widget and select following parameters:
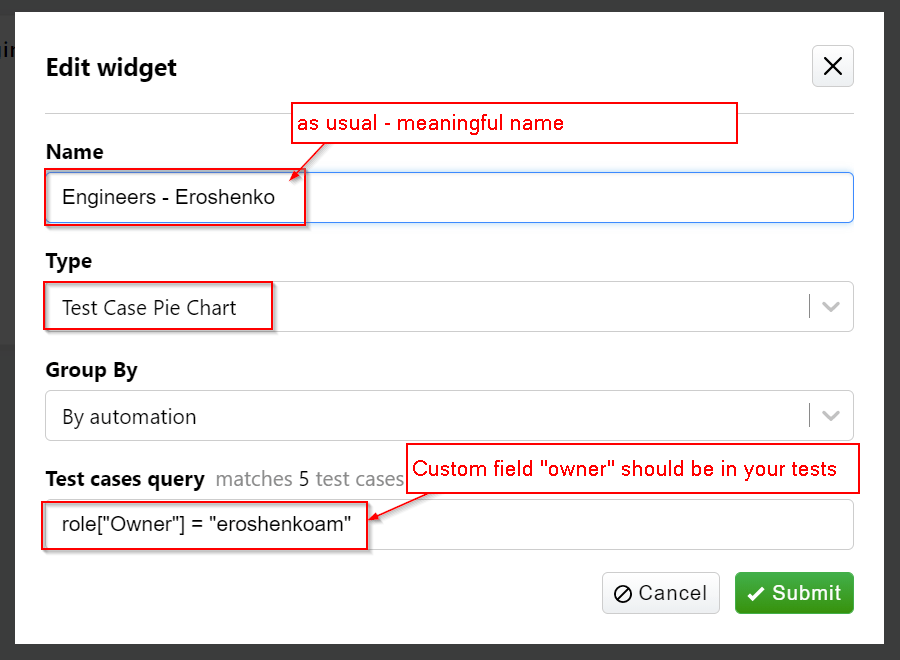
This will result in Pie chart diagram showing the number of tests for selected engineer.
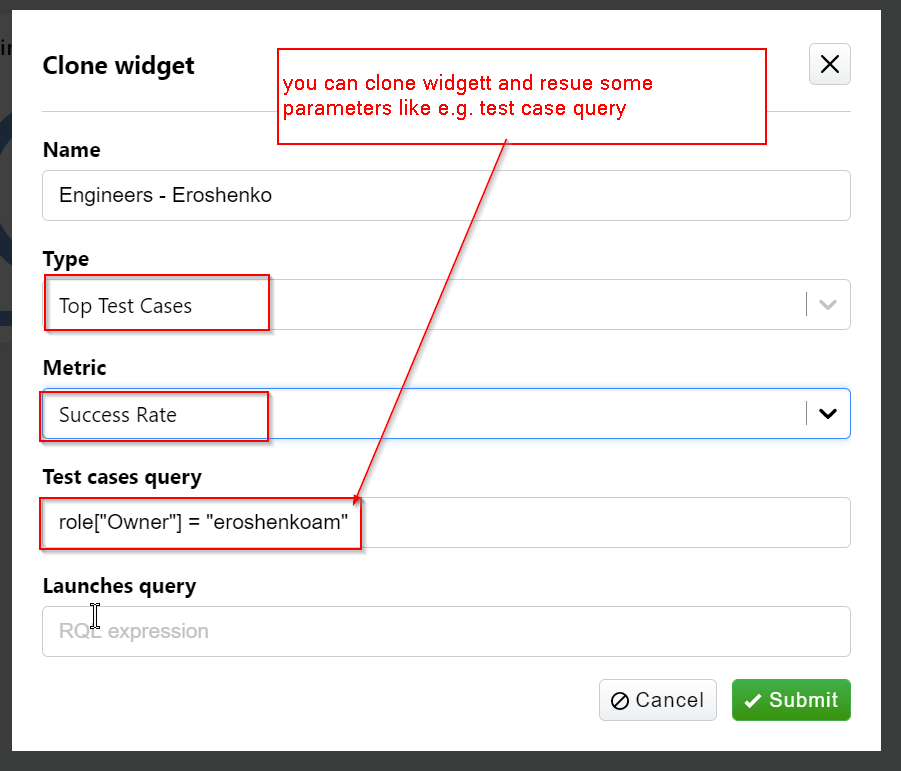
Tests success rate - top test cases widget
Click on the menu of the widget you created earlier, select clone and change some parameters as follows:
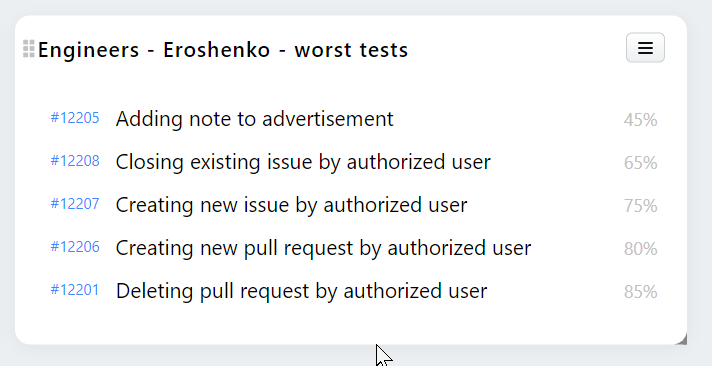
This will result in the following widget where you'll see the worst test cases by success rate on top.
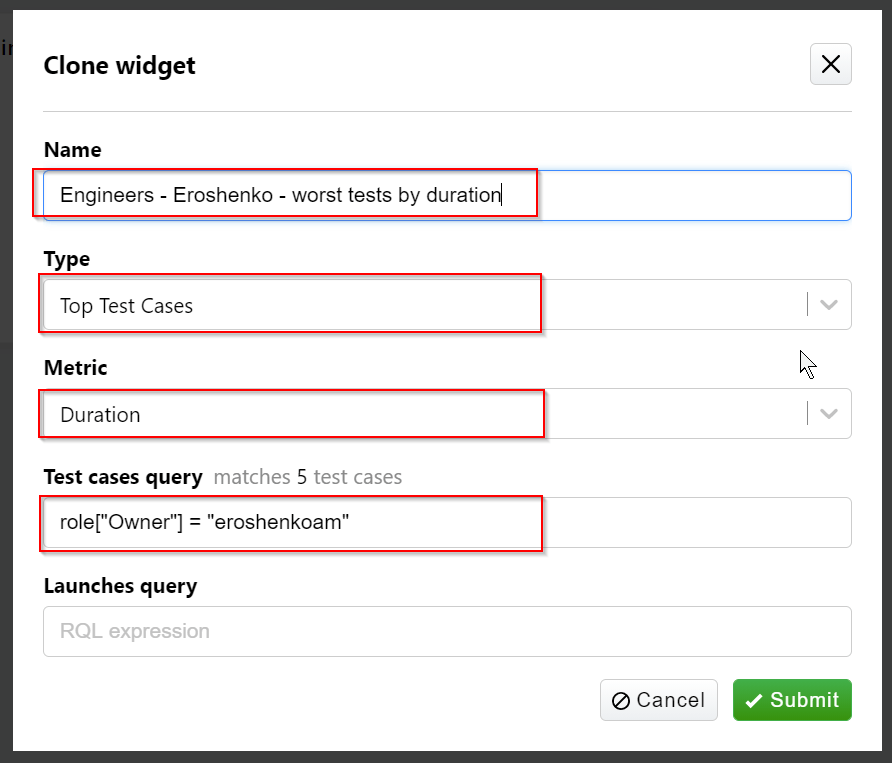
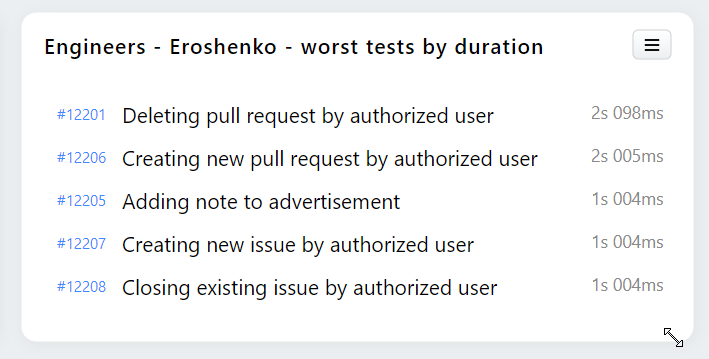
Test duration - top test cases widget
Click on the menu of the widget you created earlier, select clone and change some parameters as follows:
This will result in the following widget where you'll see the worst test cases by success rate on top.
This is general idea on how to get the analytics from Allure Testops, you can add some filters to the widgets to narrow down the requests and get more specific data.
One thing you should remember - the analytics is built only for closed Launches. So, everything in an open Launch will not appear in analytics.
